2011 Progress status of the project
|
|
|
|
Cadre de l'étude
1ère étude de cas
Perspective
Note on the simulation presented:
- Simulation is first run step by step (one step = one day) then continuously during 6 month then jumps 10 years.
- The board on the left displays simulated date, two meters for population size and % of wandering rodents (illustrative indicators)
- On the right part of the screen several figures are scan displayed : the simulated field, then various variables chosen to figure the diversity of possible indicators.
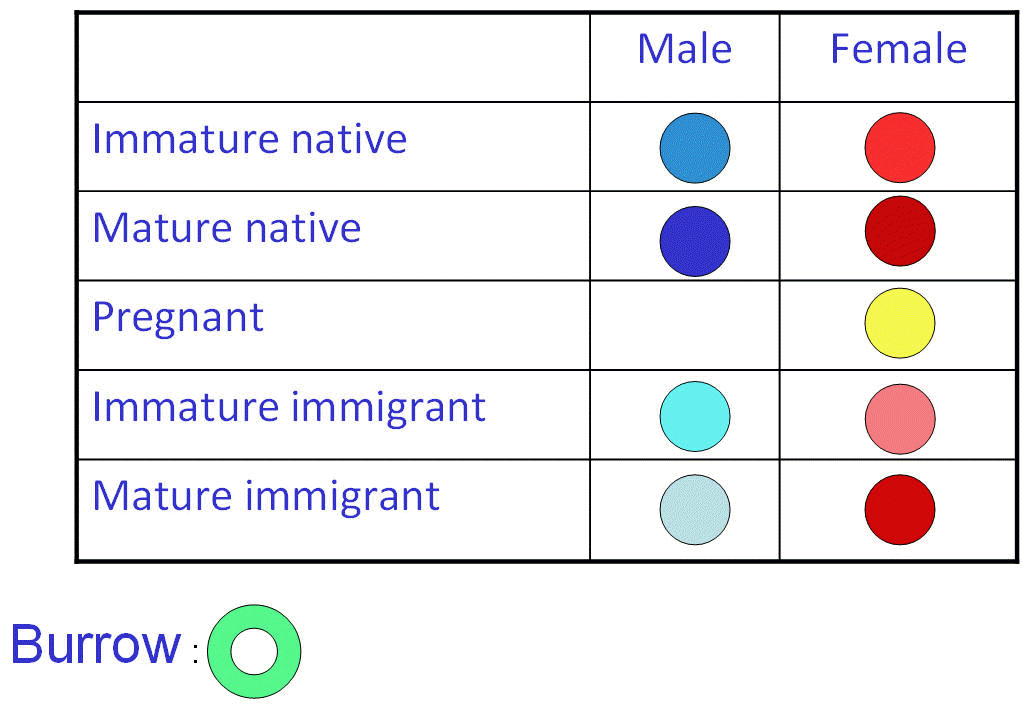
Keys for the video example :

Landscape features (fields states change seasonally) :
Modelling is realized in Java using the Repast Simphony platform.
![]() J. Le Fur, A. Realini, J.E. Longueville,
Q.Baduel - online 12 oct. 2011
J. Le Fur, A. Realini, J.E. Longueville,
Q.Baduel - online 12 oct. 2011